Reading the Review Trends chart
Reading the Review Trends chart
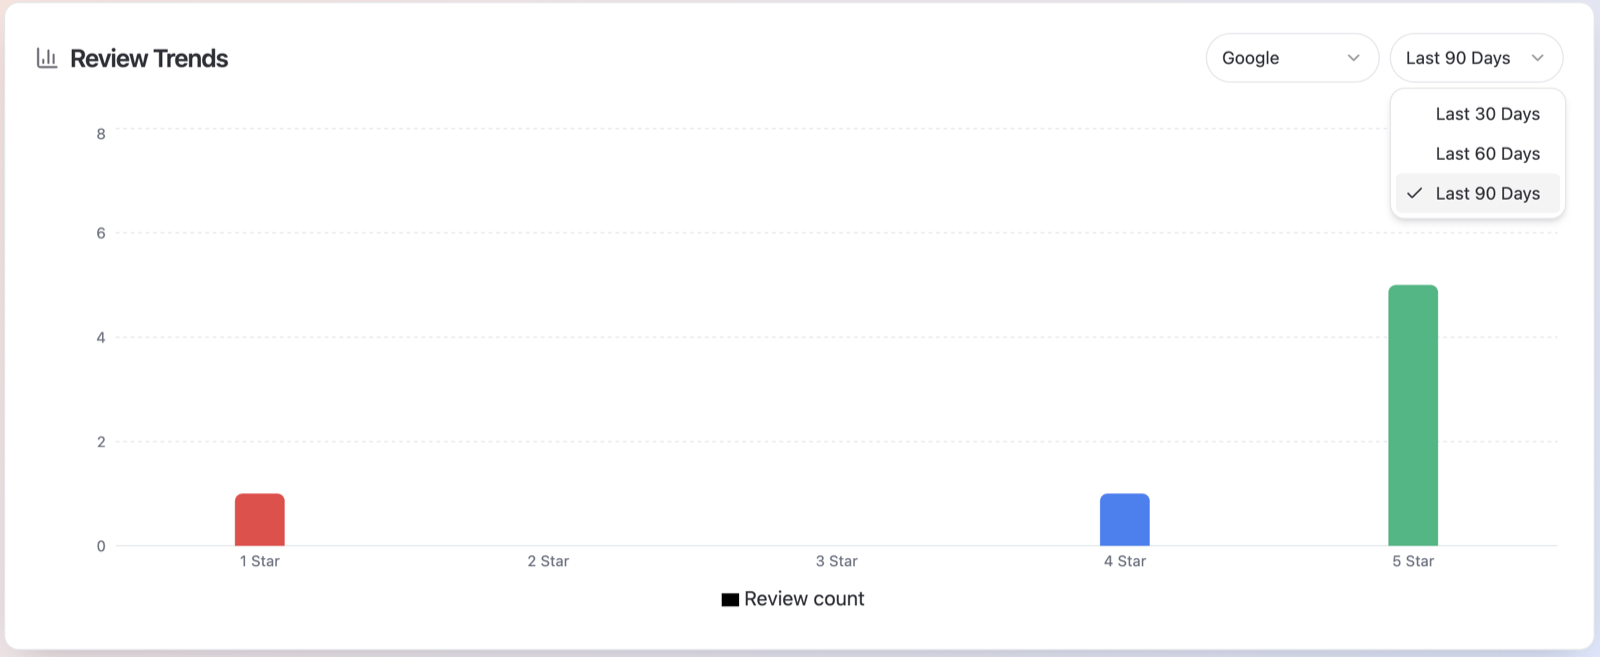
The Review Trends chart on your Dashboard shows how many reviews you've received recently, broken down by rating, so you can spot whether things are trending up or down.
Before you start
- Google review trends are available for any location with a connected Google Business Profile.
- Facebook trends only appear if a Facebook page is connected to the location.
How to use it
- On the Dashboard, scroll down to the Review Trends card.
- Use the first dropdown to pick a platform:
- Google — the bars are grouped by star rating, labeled 1 Star through 5 Star, so you can see exactly how many 5-star (or 1-star) reviews came in.
- Facebook — Facebook uses recommendations instead of stars, so the bars are labeled Positive and Negative.
- Use the second dropdown to pick a time range: Last 30 Days, Last 60 Days or Last 90 Days. The chart updates instantly.
- Hover over any bar to see the exact review count for that rating.
The legend under the chart is labeled Review count — every bar represents the number of reviews received in the selected period.
How to read it
- A tall 5 Star bar and short low-star bars mean your recent reviews are strongly positive — keep doing what you're doing.
- If 1 Star or 2 Star bars are growing when you extend the range from 30 to 90 days, something may have changed in your customer experience recently. The Review Insights page can help you find out what.
- Comparing Last 30 Days with Last 90 Days is a quick way to tell whether a problem (or a win) is new or has been going on for a while.
Tips
- Switch between Google and Facebook to make sure both platforms tell the same story. A dip on only one platform can point to a platform-specific issue, like an unanswered complaint thread.
- The chart shows counts for the currently selected location only. Use the location selector next to the Dashboard title to check another location.